Drafts Released of Maps That Could Decide Statehouse Control
TRENTON – Proposals for how to adjust the boundaries of New Jersey’s 40 legislative districts were published Monday, giving the public and politicos a chance to speak out on the parties’ unofficial blueprints for turning census results into Statehouse political power.
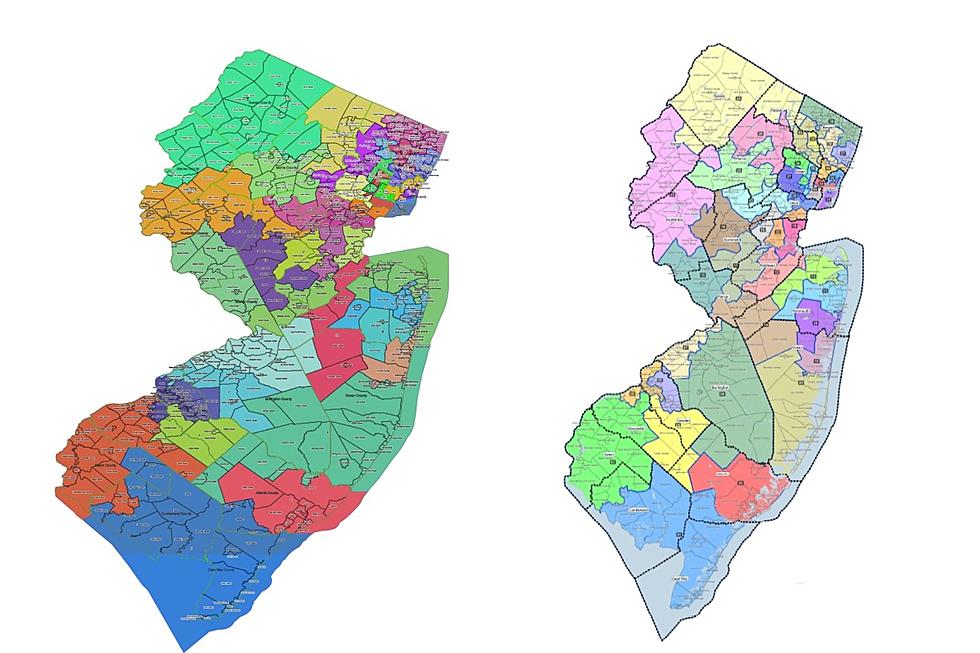
Two draft maps were released – a Democratic draft, labeled as the Turnpike map, and a Republican draft, labeled as the Parkway map. They weren’t labeled as the Democratic and GOP maps, though as anticipated it wasn’t too hard to deduce.

“Neither one of these are likely to be the final map or the final proposal that gets voted on by the tiebreaking member. There may be a lot of negotiation and back and forth here now still between now and when the final map is chosen,” said Rider University political scientist Micah Rasmussen. “But it is interesting to see each side put their map on the record and to let us digest and see what it looks like.”
Here’s where the proposals differ the most:
- Democrats would redraw the 7th and 8th districts in Burlington County into two districts where they’re favored, rather than one they win comfortably and another that’s competitive but leans Republican. Democratic Sen. Troy Singleton and GOP Sen. Jean Stanfield would be combined into a single district.
- Republicans would head off any possible rematch in the 3rd District, where Sen. Edward Durr, R-Gloucester, won an upset victory last year, by redistricting former Sen. Steve Sweeney and former Assemblyman John Burzichelli into the Camden-based 5th District.
- In Central Jersey, Republicans would turn the comfortably Republican 12th District into a competitive district, in exchange for returning the 14th District to its past status as a swing district that somewhat favors Republicans. They would also push four incumbent Democratic senators from Middlesex County into two districts.
- The 16th District, which Democrats flipped in recent years, has some of the biggest differences on the draft maps. Currently drawn in a way that favored Democrats by 14 points in five statewide elections from 2016 to 2020, it would move about 7 points toward Democrats on their map – or nearly 12 points toward Republicans on the GOP map.
- In North Jersey, the 40th District would tilt more toward Democrats – on the GOP map. That’s in part because the Republicans’ map would give themselves a better chance in the neighboring 38th District. Democrats would split Jersey City into three districts – which draw criticism from Mayor Steve Fulop – and put three Republican incumbents each into two Morris County districts.
Democrats currently hold majorities of 24-16 in the Senate and 46-34 in the Assembly, and that’s the political backdrop for each party’s strategies.
Rasmussen said Democrats are trying to emphasize continuity of representation, one of the map criteria laid out by the 11th or tiebreaking member, retired Judge Philip Carchman.
“Don’t think that that just means that he’s putting his thumb on the scale. That’s only one of a number of criteria that he’s looking at,” Rasmussen said. “But clearly the Democrats are going to emphasize that criteria and you’re going to see them put together a map that preserves the status quo. Why? They’re winning under the status quo. They like the map the way it is.”
He said Republicans are focused on a different priority cited by Carchman – competitiveness.
“They want to emphasize competitiveness in races because they’re not winning under the current map,” Rasmussen said. “They’ve made inroads. They’ve won some additional races. But they want the map to be even more competitive in the future so that they can win more races and have a chance of winning back the majority. So their map would put additional districts into play in the future than we have now.”
Early map could prompt moves
In a typical cycle, the maps would have been drawn in early 2021, right after the detailed census results arrived – produced quickly so that candidates could file by an April deadline to run in the primary. But the pandemic delayed the census, so the map will be in place more than 13 months early this time.
That could lead to unusual consequences, Rasmussen said.
“I think you’re going to see a lot of candidates actually shop districts and decide where they want to run. If somebody’s got to move, they have a year to move. And we’ve never been in that situation before,” Rasmussen said. “To the extent that the Republican map or the Democratic map or the tiebreaker’s map puts legislators together in the same district, I think you could potentially see a legislator decide, ‘Oh, I like this district better. I’m going to run over here.’”
The Democrats’ draft map contains 17 majority-minority districts, up from 15 currently. One, the 28th District, would be majority Black. One would be majority Hispanic, the 32nd District. Asian-Americans make up 35% of the proposed 18th District, and more than 25% in three other districts.
The Republicans’ draft map also contains 17 majority-minority districts. The same 28th District would be the sole majority Black district. The 35th District would be 51% Hispanic, with another four districts each around 47% Hispanic – the 33rd, 29th, 20th and 32nd districts. The Asian population would be highest in the proposed 17th District at 36%.
Your input invited
The commission holds its last scheduled public hearing on Wednesday at 6 p.m.
The hearing was originally going to be held in person but was changed to a virtual meeting being held via Zoom due to continuing COVID-19 concerns.
Those wishing to testify must register online by 3 p.m. Tuesday through either the Legislature or the Apportionment Commission website. Public testimony will be limited to five minutes per person, with extra time allotted for people needing help from a translator.
Written testimony is also welcome, with the same 3 p.m. Tuesday deadline, via email to OLSaideAPPC@njleg.org. Such testimony will be included in the official record and distributed to all commissioners.
New Jersey's new congressional districts for the 2020s
Gallery Credit: Michael Symons
Where NJ's 'red wave' of the 2021 election was reddest
Gallery Credit: Michael Symons
More From WPG Talk Radio 95.5 FM