Really? New Jersey Ranked One of the Top Grossest States in the Nation
Just in time for summer, a popular website has ranked our beloved state one of the grossest in the nation.
As a matter of fact, not only is New Jersey in the top ten, but we're almost in the top five.
However, misery loves company and the states that surround us did just as poorly. More on that in a moment.
According to the editors at Zippia.com, the great Garden State is America's sixth grossest state.
As we all know, it's easy to beat up on New Jersey.
When those from other, lesser states (i.e. Delaware) think of us, they picture those stereotypical images of the refineries along the Turnpike, big cities shrouded in smog, endless traffic jams, and once-great cities that have fallen on hard times.

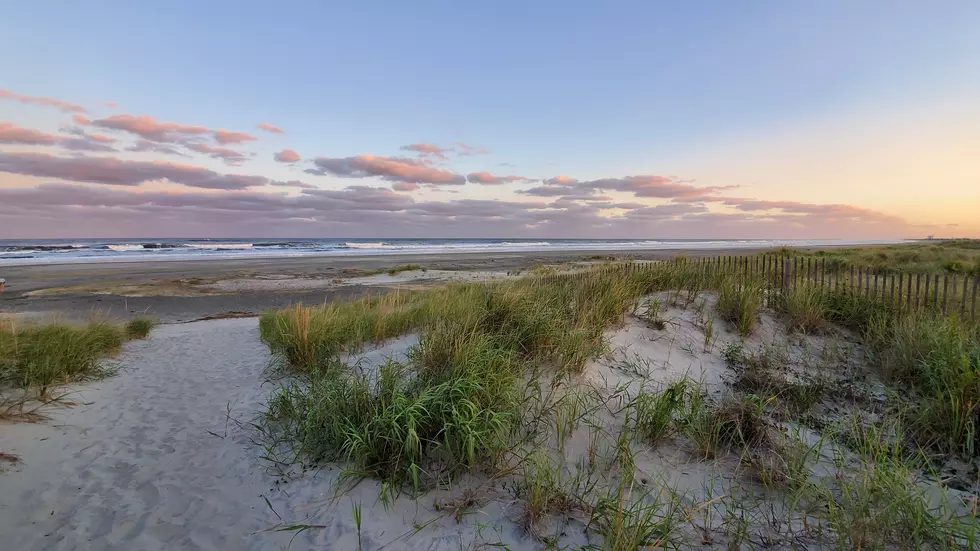
And while some of that is true, that is not New Jersey.
This is the Jersey that many of us know:
For their rankings, Zippia.com took things like pollution, trash, the spread of illness, and "some cultural factors" into account.

So how did New Jersey get to be so high on the list?
The tiny, densely populated state of New Jersey has a trash problem. In fact, 0.0421% of the state is landfill- More than any other state in the country.
That's it?
What a crock.
At least we're not alone in our trashy misery.
Connecticut, New York, Pennsylvania, and Delaware, are all in the top ten.
Of course, you need to keep in mind that this is likely one of those lists made by people who haven't actually spent any time in New Jersey.
If that's the case, some Jersey-style expletives should be sent their way along with a giant seagull to steal their lunches and crap on their shoulders.
The Trashiest Towns in New Jersey
Gallery Credit: Matt Ryan
Up or down? Average property tax changes in NJ in 2022
Gallery Credit: Sergio Bichao/Townsquare Media
More From WPG Talk Radio 95.5 FM