Bottoms Up! The Drunkest Places in New Jersey
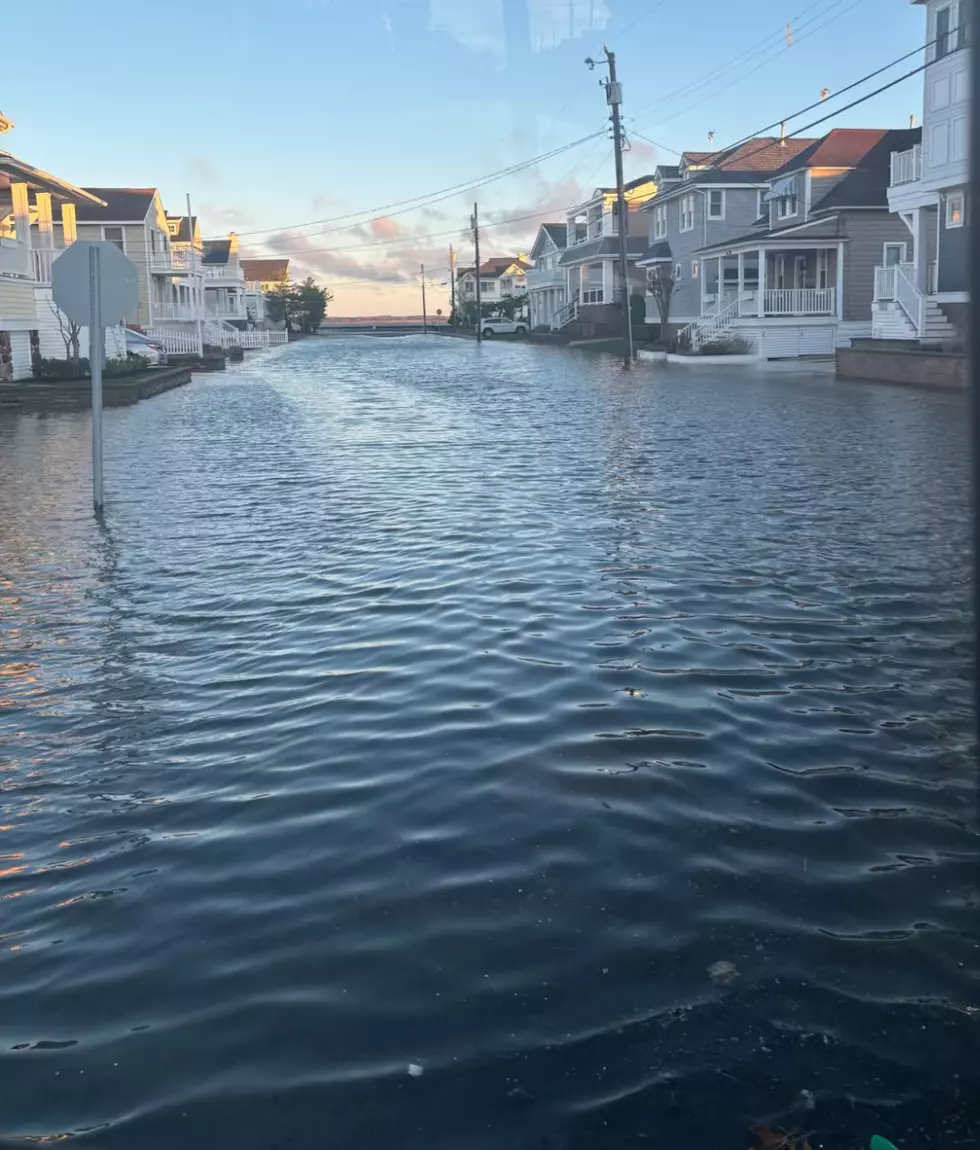
Many were surprised to learn this week that Ocean City — one of the state's few "dry" towns where bars or liquor stores are not allowed to operate — was also the state's drunkest, according to USA Today.
The Townsquare News Network's own review of state health data reveals that Ocean City has plenty of company down in South Jersey. The drunkest of the state's 21 counties is Cape May.
We looked at data that measured the percentages of excessive and binge drinkers in each county as well as the percentage of deadly automobile crashes attributed to alcohol use. We ranked the counties after assigning points based on those percentages.
The results were interesting. One county that ranked low for drunk behavior happens to be home to one of the state's hottest cities for nightlife. What gives? That might have something to do with the fact that the state Department of Health's New Jersey Behavioral Risk Factor Survey for 2016 is based on where people live, not where they party.
For the purpose of the survey, excessive drinking is defined as 30 drinks for women and 60 drinks for men in the past month. Binge drinking is defined as at least five drinks for men or four drinks for women in at least one sitting in the past month.
The survey also measured the percentage of people who drank any alcohol at all.
The annual state survey is conducted among adults but excludes people in living in college dormitories, nursing homes and military barracks.
NJ's drunkest counties
#21
— People who drink: 59.3%
— Excessive drinkers: 1.6%
— Binge drinkers: 14.7%
— Driving deaths tied to alcohol: 22.5%
#20
— People who drink: 44.8%
— Excessive drinkers: 2.1%
— Binge drinkers: 15.6%
— Driving deaths tied to alcohol: 20.7%
#19
— People who drink: 60.3%
— Excessive drinkers: 3.5%
— Binge drinkers: 14.1%
— Driving deaths tied to alcohol: 20.6%
#18
— People who drink: 54.6%
— Excessive drinkers: 4.4%
— Binge drinkers: 14.5%
— Driving deaths tied to alcohol: 16.8%
#17
— People who drink: 46.3%
— Excessive drinkers: 3.5%
— Binge drinkers: 12.8%
— Driving deaths tied to alcohol: 25.6%
#16
— People who drink: 52.5%
— Excessive drinkers: 2.8%
— Binge drinkers: 17.6%
— Driving deaths tied to alcohol: 26.9%
#15
— People who drink: 60.7%
— Excessive drinkers: 5.4%
— Binge drinkers: 13.1%
— Driving deaths tied to alcohol: 20.4%
#14
— People who drink: 57.2%
— Excessive drinkers: 3.4%
— Binge drinkers: 17.7%
— Driving deaths tied to alcohol: 25.3%
#13
— People who drink: 55.5%
— Excessive drinkers: 6.%
— Binge drinkers: 12.9%
— Driving deaths tied to alcohol: 20.6%
#12
— People who drink: 63.9%
— Excessive drinkers: 4.8%
— Binge drinkers: 17.%
— Driving deaths tied to alcohol: 22.4%
#11
— People who drink: 53.1%
— Excessive drinkers: 4.9%
— Binge drinkers: 17.4%
— Driving deaths tied to alcohol: 23.4%
#10
— People who drink: 56.8%
— Excessive drinkers: 3.4%
— Binge drinkers: 15.2%
— Driving deaths tied to alcohol: 35.%
#9
— People who drink: 65.9%
— Excessive drinkers: 2.%
— Binge drinkers: 27.%
— Driving deaths tied to alcohol: 26.4%
#8
— People who drink: 58.4%
— Excessive drinkers: 5.8%
— Binge drinkers: 18.%
— Driving deaths tied to alcohol: 21.5%
#7
— People who drink: 53.%
— Excessive drinkers: 6.4%
— Binge drinkers: 16.2%
— Driving deaths tied to alcohol: 21.1%
#6
— People who drink: 61.3%
— Excessive drinkers: 7.3%
— Binge drinkers: 15.2%
— Driving deaths tied to alcohol: 19.6%
#5
— People who drink: 61.2%
— Excessive drinkers: 6.%
— Binge drinkers: 17.2%
— Driving deaths tied to alcohol: 26.7%
#4
— People who drink: 50.1%
— Excessive drinkers: 6.3%
— Binge drinkers: 13.7%
— Driving deaths tied to alcohol: 37.5%
#3
— People who drink: 65.%
— Excessive drinkers: 7.5%
— Binge drinkers: 26.3%
— Driving deaths tied to alcohol: 26.5%
#2
— People who drink: 68.4%
— Excessive drinkers: 7.2%
— Binge drinkers: 27.4%
— Driving deaths tied to alcohol: 29.%
#1
— People who drink: 60.%
— Excessive drinkers: 10.5%
— Binge drinkers: 20.3%
— Driving deaths tied to alcohol: 32.7%
More From WPG Talk Radio 95.5 FM


